What profitable patterns can we detect with Price Breakout Pattern Scanner?
- Head and Shoulder – This pattern is one of the most commonly discussed patterns by traders and often the professional technical analyst include these patterns to predict the future path of price. The formation of Head and Shoulder indicates the potential bearish breakout (downwards).
- Reverse Head and Shoulder – This pattern is the reverse formation of the Head and Shoulder. By some traders, this pattern is also called as the Inverse Head and Shoulder. The formation of the Reverse Head and Shoulder indicates the potential bullish breakout (upwards).
- Double Top – When the price hits resistance level twice and decline toward the support level, the trader can anticipate sudden bearish breakout through the support level.
- Double Bottom-The double bottom pattern is the reverse shape of the Double Top. With this pattern, you may trade on upwards breakout through resistance level.
- Triple Top – When the price hits resistance level three times and decline toward the support level, the trader can anticipate sudden bearish breakout through the support level. The way you trade is identical to Double Top.
- Triple Bottom-The triple top pattern is the reverse pattern of the triple top. Trader can anticipate upwards breakout as in double bottom pattern.
- Triangle-Triangle pattern appears very frequently and a lot of traders don’t realize their appearance in their chart. However if you see some sudden breakout from your chart, then it is most likely the triangle pattern was just formed. Triangle pattern represents the trend consolidation (range market) and of course this will be followed by large price movement afterwards. Several different types of triangle pattern include symmetric Triangle, Ascending Triangle and Descending Triangle. Trading recommendation on these Triangle pattern is that you should trade on the price breakout direction. This triangle pattern is one of the most traded patterns by many price action traders. They work very well for most of pairs.
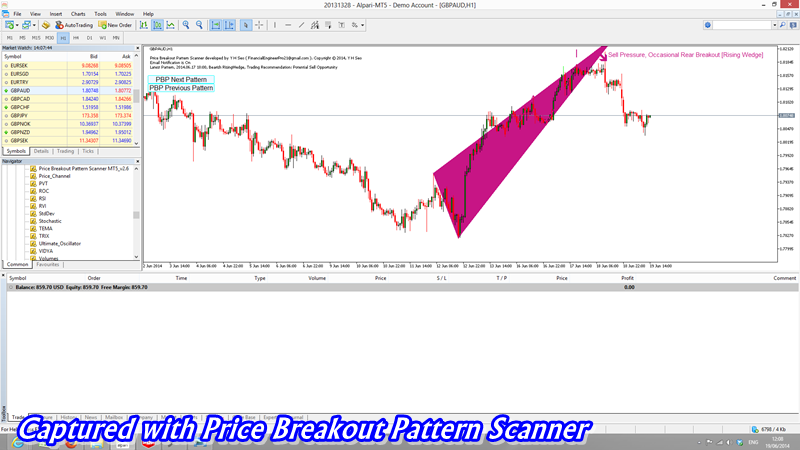
- Rising wedge- This pattern is similar to triangle however their angle is often tilted far more than standard triangle. They also behave little differently too. Rising wedge indicates the potential sell pressure in the future. This pattern can also accompany some bearish breakout too. When the angle of rising wedge is flat, the price may breakout in opposite direction.
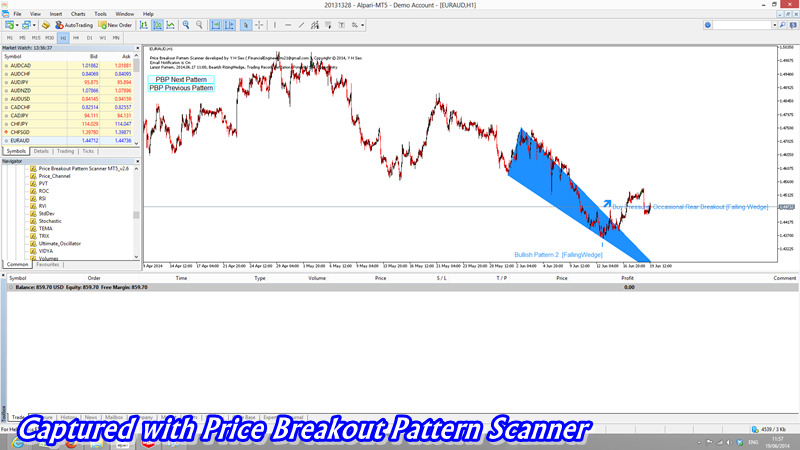
- Falling wedge-Just like rising wedge, this pattern has similar look to triangle. Falling wedge indicates the potential buy pressure in the future. This pattern can also accompany some bullish breakout too. When the angle of falling wedge is flat, the price may breakout in opposite direction.
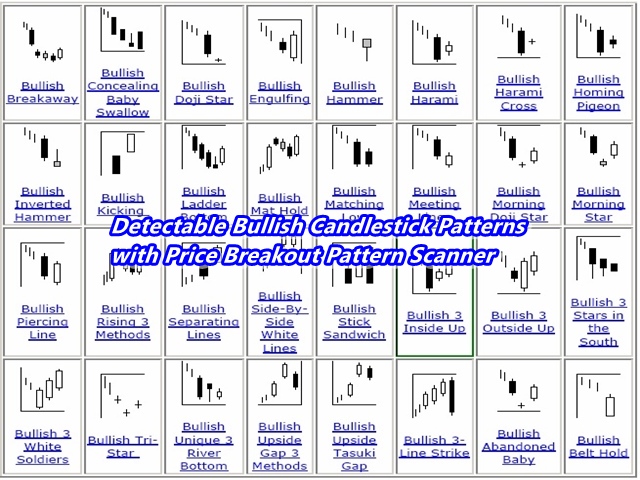
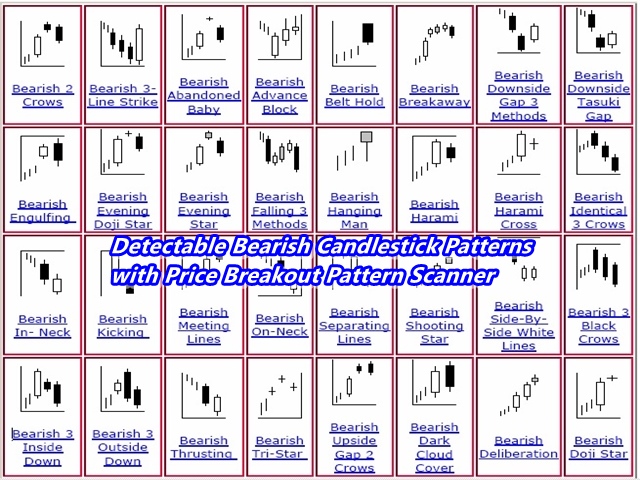
- Candlestick patterns – Besides these price breakout patterns, the Price Breakout Pattern Scanner can detect 52 different bearish and bullish candlestick patterns. The candlestick patterns include hanging man, shooting star, engulfing, dogi, harami, kicking, etc.

Main Feature of Price Breakout Pattern Scanner
- This software can send an email to you when price breakout pattern is detected on any charts. So even when you are outside, you can be still notified and trade as long as you have a small laptop.
- You can attach this Price Breakout Pattern Scanner over many different charts as the scanning times are pretty quick. Recommended time frame is hourly and 4 hourly and daily.
- The software save historical patterns found over the past price data in the memory and you can bring the historical patterns on your chart and build your own strategy using these historical patterns. This can be readily done by changing “Max number of pattern to display” variable. Also by just clicking buttons in your chart, you can easily reply any patterns one by one. You can isolate each pattern or many patterns in your chart and can develop your own trading strategy.
- The candlestick pattern recognition is also added value to this Price Breakout Pattern Scanner. The detectable candlestick patterns include 52 different bullish and bearish candlestick patterns.
- The Price Breakout Pattern Scanner is perfectly compatible with “Harmonic Pattern Plus” Software (http://www.mql5.com/en/market/product/4475). You can combine the Price Breakout pattern scanner together with the Harmonic Pattern Plus software on one chart. You will see how these two different types of patterns are interacting together. You can make far more accurate trading decision than using a single trading system. Before, these sorts of specialized tools were not available to small investors but only the big inventors such as hedge fund and investment bank, who could afford to build through their employed software developers. Now you can be equipped with the same advanced technology as them. By monitoring multiple of currency pairs using these two systems, you will literally have all the vital information on your finger tips. You just need to trade on most profitable timing with smallest risk.
- Without too much tweaking, the software is ready to use as shipped.
How to use Price Breakout Pattern Scanner for your profitable trading
When you attach this Price Breakout Pattern Scanner on your chart, you will find this software is very instructive. Therefore, even if you are beginner, you can start to trade with this software. For each pattern, you will see arrow indicating the trading direction as well as instruction. Except rising wedge and falling wedge, you should trade all the other patterns on breakout only. If the price does not breakout and the pattern is not completed then do not trade. So you won’t lose anything. For rising wedge and falling wedge, you can trade on breakout too. However these two patterns often provide you overall trend direction change. Also remember that if the angle of rising wedge and falling wedge is near flat, then the breakout might appear on the opposite direction to the instructed direction. When you reply each historical pattern detected with this scanner, you will naturally see what I mean by this. By going through the historical pattern study, you will be more confident with your trading with this software. When you study the historical patterns with this software, focuses on followings:
- Count the success rate of each pattern
- Note with which currency pairs these pattern work better than the other
- Note with which time frame these pattern work best
- What technical indicators such as moving average, RSI, etc, can increase success rate of these patterns when they are used together
- Observe the timing when to place trade when the price breakout
All these profitable information will be ready on your finger tip with this Price Breakout Pattern Scanner. You can study any currency pairs including oils, gold and silver, etc.
![]()
![]()
Get Risk Management Tool to assist your trading And it's free
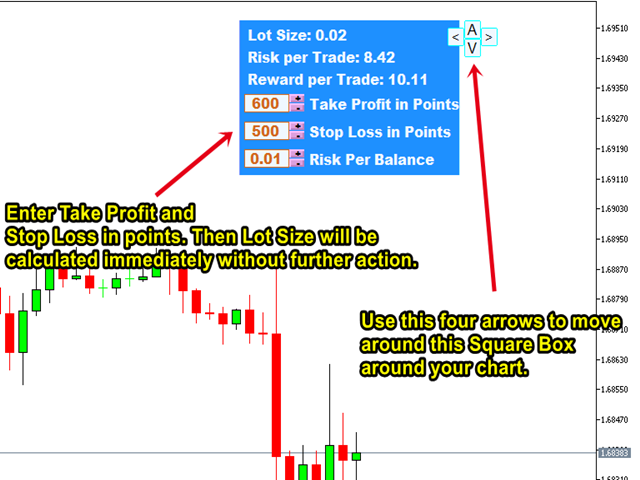
One single most important factor in the financial trading world is to control your risk. We found two interesting observations when we train Junior Forex Traders. Firstly until the trader understand the Risk Management, the trader's expected return isn't consistent. For example, some trader earns 100% in a month but they lose 100% in next month. This is not the path we recommend for you. Secondly after the risk management is taught, the traders really start to enjoy the trading. It is because they know that their risk is controlled and they have a piece of mind even with holding overnight position. We want you to be profitable but we also want you to enjoy trading with our software too. Therefore, we provide Risk Management Tool to you for free of charge. It is originally designed to work with our software including Harmonic Pattern Plus, Price Breakout Pattern Scanner and Sideways Market Analyzer. However this Risk Management Tool will work on its own without other Software. So please enjoy your trading with this free tool. How to use this tool is very simple. The tool will calculate the lot size according to your specified Risk per Balance when you enter Stop Loss and Take Profit in points value.
- Recommended Risk per Balance is 1% (0.01) to 3% (0.03) depending on your trading skills and experience for each trade.
- Recommended to enter trade if Take Profit is greater than Stop Loss unless you are scalper.
- Aim 3 to 5 trades per day at least.
We provide the Risk Management Tool for both Meta Trader 4 and Meta Trader 5. Just click the link below to download this software.
![]()
![]()
Your Definite Guide for Price Action and Pattern Trading Package
Our Forex Trading software are designed for different level of traders from beginners to Professional Traders. Here you can find out the complete list of Price Action and Pattern Trading Software.
Starter Trading Package 1
Price Action Candle Detector + Risk Management Tool (free) + NRTR (free, http://www.mql5.com/en/code/8349)
Intermediate Trading Package 1
Harmonic Pattern Plus + Risk Management Tool (free) + other technical indicator Template provided from us (free).
Intermediate Trading Package 2
Price Breakout Pattern Scanner + Risk Management Tool (free) + other technical indicator Template provided from us (free).
Professional Trading Package 1
Harmonic Pattern Plus + Price Breakout Pattern Scanner + Risk Management Tool (free) + other technical indicator Template provided from us (free).
Professional Trading Package 2
Harmonic Pattern Plus + Price Breakout Pattern Scanner + Sideways Market Analyzer + Risk Management Tool (free) + other technical indicator Template provided from us (free).
Few Tips on choosing the Right Package for You
In our experience, the prediction power between Harmonic Pattern and Price Breakout Pattern is similar. Here is our advice for weighting our Price Action and Pattern Trading software:
Harmonic Pattern = Price Breakout Pattern > Price Action Candle Detector
Sideways Market Analyzer works more like EA. So it is difficult to compare it with other software. The main difference between these software is that harmonic Patterns and Price breakout patterns are formed over many candles bars (i.e. sometimes over 100 candle bars.) whereas Price Action candle Detector detects patterns with 2 or 3 candle bars. Therefore, Harmonic Pattern and Price Breakout Pattern naturally provide you stronger market view over Price Action Candle Detector. Having said this, Price Action Candle Detector is still very accurate. In terms of learning curve (how easy to learn the software), our rating is like this:
Price Action Candle Detector > Harmonic Pattern > Price Breakout Pattern > Sideways Market Analyzer
Just like “The little book of Sideways Market by V. N. Katsenelson” introduces readers the importance of understanding Sideways Market, Sideways Market Trading Strategy can accelerate your success if you are aiming to become the top 5% traders. In our experience, Mastering Sideways market should be followed after your complete training for bullish and bearish market trading strategy. Therefore, we added the Sideways Market Analyzer to the very end of our list.
Here are the links for all the software to form a complete Price Action and Pattern Trading System
- Harmonic Pattern Plus (More info at http://harmonicpattern.ucoz.co.uk/)
- Price breakout Pattern Scanner (More info at http://fxpricebreakout.ucoz.com/)
- Sideways Market Statistical Analyzer (More info at http://tradesideways.ucoz.com/)
- Price Action Candle Detector (More info at http://www.mql5.com/en/market/product/5452)
- Risk Management Tool (Free, More info at http://www.mql5.com/en/market/product/5452 )
- NRTR (Free, More info at http://www.mql5.com/en/code/8349)
Important Forex Trading Disclaimer
Trading in Forex Market involves the risk of loss. Please consider carefully whether trading and investment in Forex market are appropriate to your financial situation. Only risk capital should be used when trading and investing. Investors and Traders could lose more than their initial investment. You must agree that you have sufficient knowledge and experience in Forex market before you use any of our Price Action and Pattern Trading Software Package as well as other EAs provided by us. Past results are not necessarily indicative of future results. The risk of loss in trading can be substantial, carefully consider the inherent risks of such an investment in light of your financial condition. You should be aware of all the risks associated with foreign exchange trading and If necessary, please seek advice from an independent financial advisors if you have any doubts about Forex market and trading in Forex market. If you receive executable files for our software and expert advisors and installed on your PC or laptop, then refund is not available.