
Introduction to Price Breakout Pattern Scanner
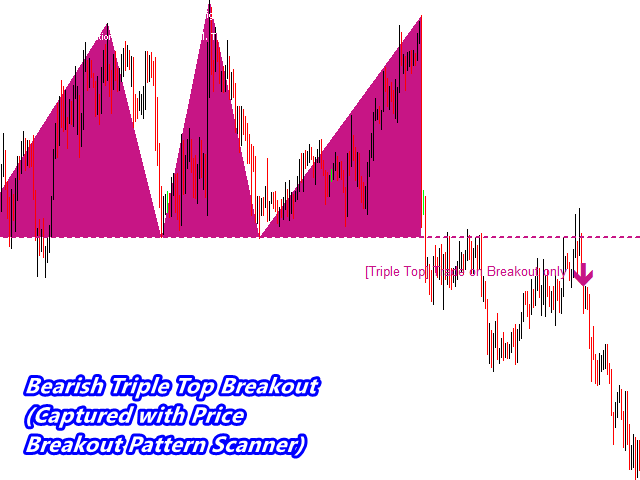
Most of traders in Forex market must be familiar with the name “Head and Shoulder”, “Double Top”, “Triple Top”, “Symmetrical Triangle”, etc. These are the common price patterns appearing in the price charts of Forex, Futures and Stock markets. When you spot these patterns in your chart, you can trade upon the price breakout. Many professional traders prefer these kind of price breakout strategy over the technical indicators based strategy because the risk to rewards ratio is simply great. In addition, your exposure on the market is very short minimizing your holding risk too. You could probably name some good traders exclusively using these breakout patterns and reached 6 figure account size. The “Price Breakout Pattern Scanner” is designed to recognize these profitable breakout patterns from your chart. The main idea behind the “Price Breakout Pattern Scanner” is to automate the pattern recognizing process and help the traders to make faster and more accurate trading decision. It doesn't matter you are beginner or professional trader. The Price Breakout Pattern scanner can definitely add high value towards your successful trading.
Why Price Breakout Pattern works and profitable?
Price patterns are visual representation of market psychology. The typical market psychologies are excitation, optimism, pessimism, caution, fear, surprise, etc. Just like an emotional person can’t hide their emotion from their face, it is difficult for the market to hide their emotion from us. This is simply because market consists of human traders which are extremely emotional by themselves and extremely influential by other peoples’ emotion.
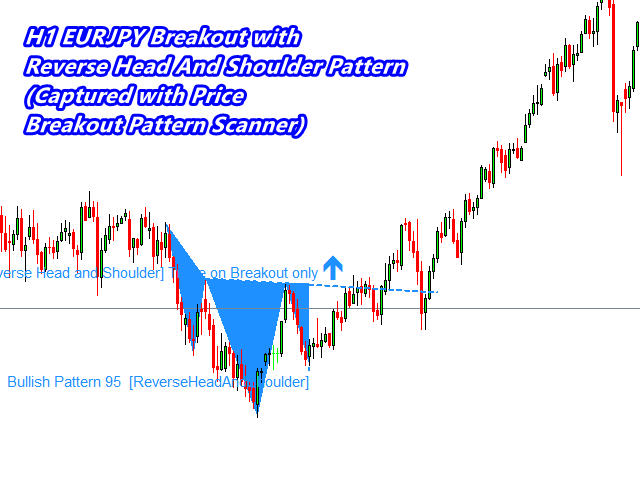
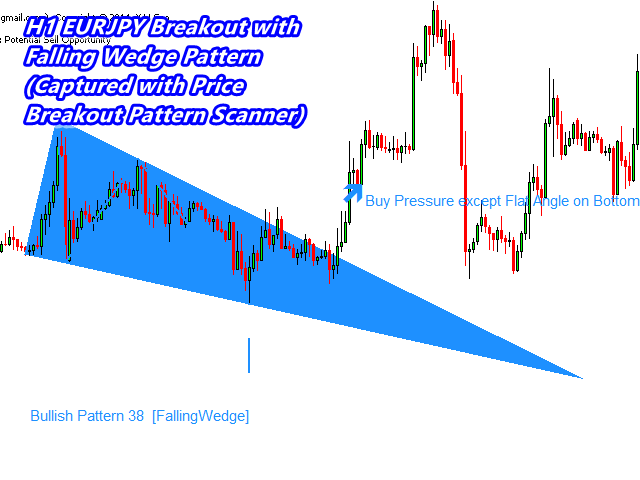
To identify such market emotions, the traders learned the wisdom of using extreme values in the price charts and also using the change in price variation. One very good example is the head and shoulder breakout pattern. Head and shoulder breakout pattern is identified by three extreme values with the latest extreme value (F) lower than previous extreme value (D). This is the simple representation of growing pessimism in the market after the price reached top at point D. The traders, who went long before point A, they start to fear when the point F appears and the price start to fall down. Of course, the well trained traders will exit first then many other traders will follow because they see price going down. Then any bad market news after point F will double up their impact and they will likely to create hearding behaviour among crowd. The selling pressure will further accelerate. This is just one simple example on how this breakout patterns works. Likewise, many triangle breakout patterns work by identifying the market psychology with decreasing price variation. The consolidated price tends to explode like spring near the tip of the triangle.
Whether you are capable of identifying these breakout patterns manually or not, the fact is that our price breakout pattern scanner can make your trading far more productive. You will be relieved from painful manual drawing and therefore, your decision making will be faster. Also human traders are well known for psychological bias when they are mentally tired. Trading activity is mentally rigorous and traders tend to get tired quite quickly. During such a period, you will start to see what you want to see. Your pattern identification works are no more accurate and trading based on these inaccurate patterns will hurt your trading performance. This kind of psychological bias is well studied in behavioural finance and psychological paradigm. We recommend our advanced pattern identification software to assist your trading for your own goods and for more profitable trading.

Some useful links for Price Breakout Pattern Trading Strategy
You can always draw Price Breakout Pattern manually on your charts. We are not against that idea. However, manual drawing of head and shoulder patterns or other triangle patterns are really painful and time cosuming task especially when you are requred to do multiple currency analysis. The manual identification of these Price Breakout Pattern can be often inaccurate when you are mentally tired or when you are too emotional. Therefore, we recommend to use fully automatic scanner like our Price Breakout Pattern Scanner to improve your trading performance. Even if you are using Automatic Scanner, we still recommend the through understanding on trading strategy with Price Breakout Patterns. Therefore, here we provide some useful links for you.
- Visit "Charts Pattern" webpage from Investopedia at http://www.investopedia.com
- Visit "Chart Pattern" Webpage from StockChart.com at http://stockcharts.com
- Visit "Chart Pattern" webpage from Incredible charts at http://www.incrediblecharts.com